
Charlie Custer
Published
August 19, 2025
What is the fraud rate? It’s a simple question, but unfortunately not a simple answer.
Confirmed identity fraud is a lagging indicator — charge-offs often come months or years after the initial application, and a confirmed fraud diagnosis typically comes even later, if it ever comes.
To provide a more real-time view into how fraudsters are attacking financial institutions (FIs) and other organizations, SentiLink has compiled a report on the fraud rates and trends we've observed in 2025.
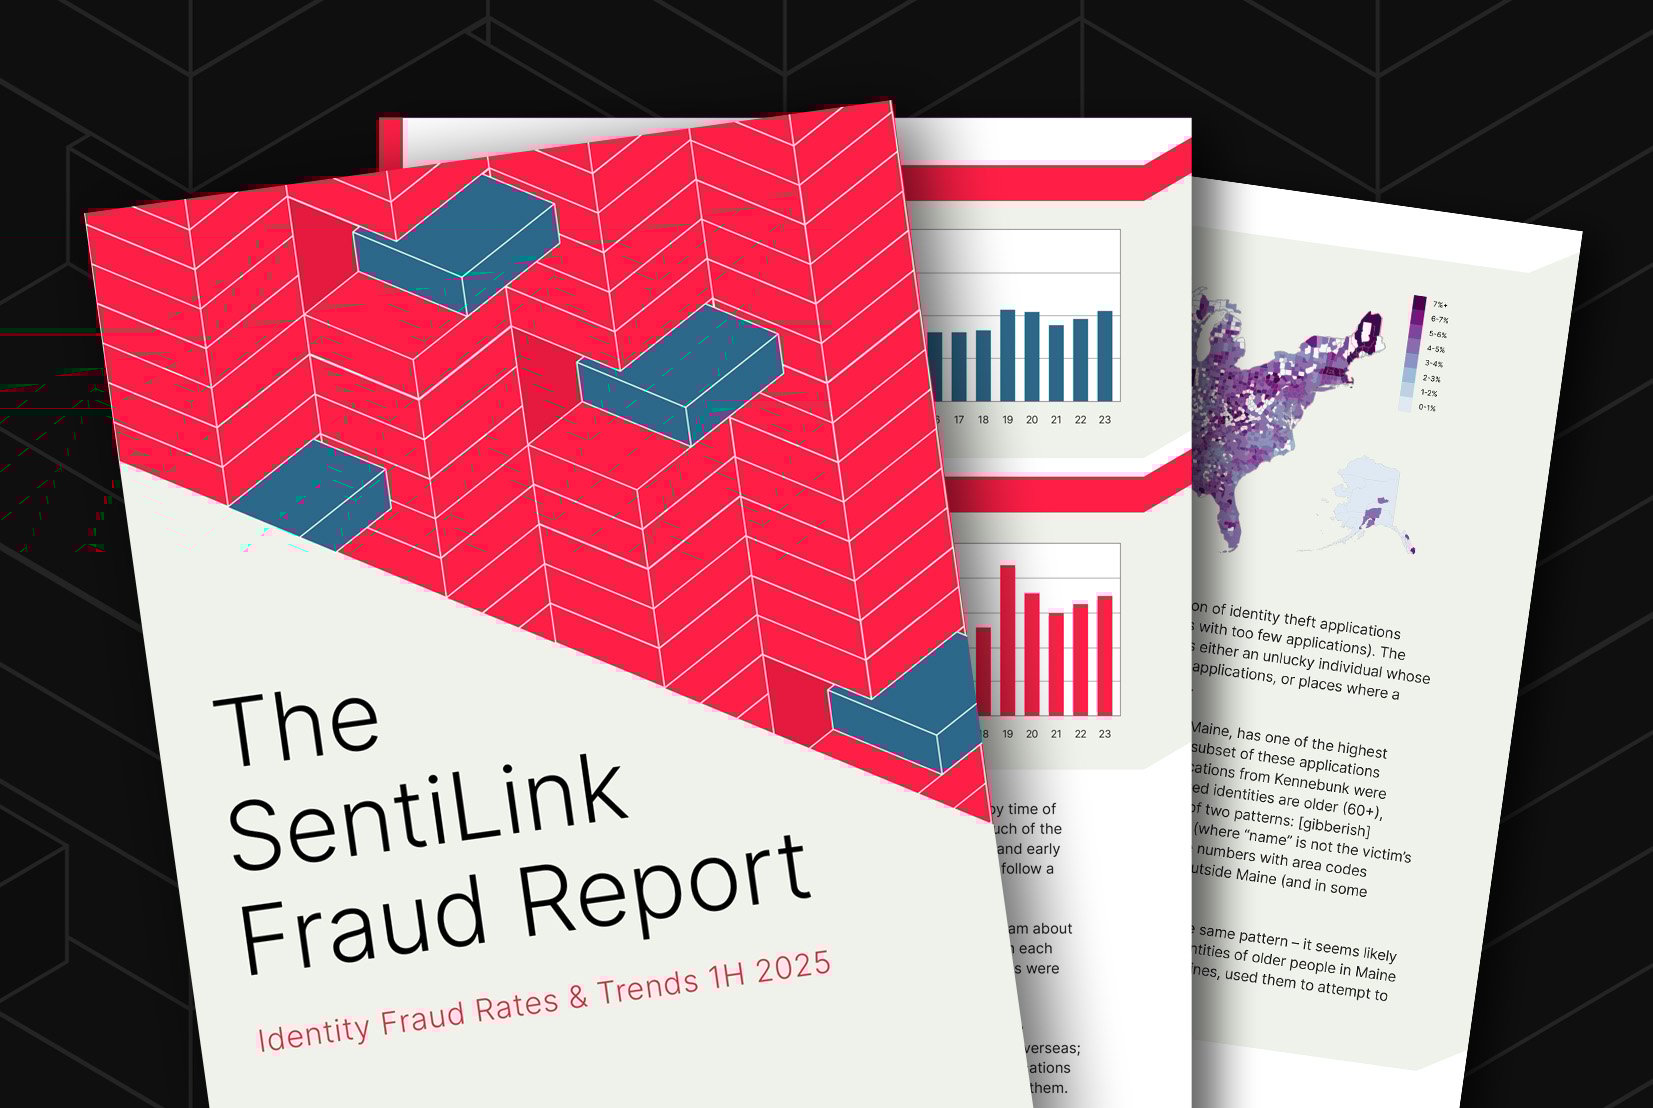
The SentiLink Fraud Report: Identity Fraud Rates & Trends 1H 2025 is based on a rigorous analysis of more than 236 million account opening applications from the first half of 2025.
In addition to overall fraud rates, the report covers industry-specific fraud rates and other trends in credit card lending, auto lending, other consumer lending, Demand Deposit Accounts (DDA), and telecom. It also attempts to answer some additional questions we received in response to our 2H 2024 report, such as “what are the most common signs of application fraud?”
(Note that when we refer to "fraud rates" here and in the report, we're talking about the rates of identity theft and synthetic fraud in account opening applications, not the rates of fraudsters who successfully open accounts and bust out).
What were the fraud rates in 1H 2025?
Overall, we found an average identity theft rate of 4.81% and an average synthetic fraud rate of 0.87% over the course of the first half of 2025. The identity theft rate rose over the course of the half, influenced by prolonged elevated rates in several industries (DDA and telecom) as well as large-scale fraud attacks targeting multiple institutions in other industries (credit card and auto lending).  We also mapped out hotspots for identity theft victims (left, in blue) and hotspots for synthetic fraudsters (right, red):

What else is in the report?
Quite a lot! The full report runs 39 pages, not counting a lengthy appendix section that details all of our analysis methodology. Here are some of the questions you'll find answers to in your free copy of the full report:
- What were the weekly fraud rates in the credit card, auto lending, consumer lending, DDA, and telecom industries?
- What were the strongest fraud signals associated with identity theft and synthetic fraud, both overall and in each industry?
- What industries suffered major fraud attacks in 1H 2025?
- At what time of day are fraud rates highest?
- Are applications with ITINs rather than SSNs more risky?
- What fraud trends did our Head of Fraud Insights and Fraud Intelligence Team observe in 1H 2025?
- …and much more!
We’re giving this report away because we believe better fraud prevention starts with better data.

Where do these numbers come from?
The report is based on our observations, both quantitative and qualitative, as we help our 400+ partners combat fraud. We selected a subset of more than 236 million real account opening applications to which we could assign fraud probabilities for both identity theft and synthetic fraud based on real-world performance data. We then calculated fraud rates based on these probabilities.

But that's just a short summary of the basics; the full report includes an appendix section (pictured above) with detailed discussion of the methodology for all quantitative analyses, as well as a transparent discussion of the data's limitations. Grab your copy of the report and see for yourself (and if you still have questions, we're happy to answer them).
Subscribe
Share
Related Content

Blog article
June 26, 2026
We Went Looking for a Missing Corvette. We Found a Machine for Laundering Cars
Read article
Blog article
June 16, 2026
Where Do Fraudsters Start With Stolen Identities?
Read article
Blog article
June 10, 2026
$1.8 Million in Cars Went Missing. Could a Machine Learning Model Have Prevented It?
Read article