
Charlie Custer
Published
March 10, 2026
What is the fraud rate, and how does your fraud rate compare to the rest of your industry, or across industries?
These can be surprisingly difficult questions to answer, especially if you want up-to-date intelligence. Confirmed identity fraud is a lagging indicator — charge-offs often come months or years after the initial application, and a confirmed fraud diagnosis typically comes even later, if it ever comes.
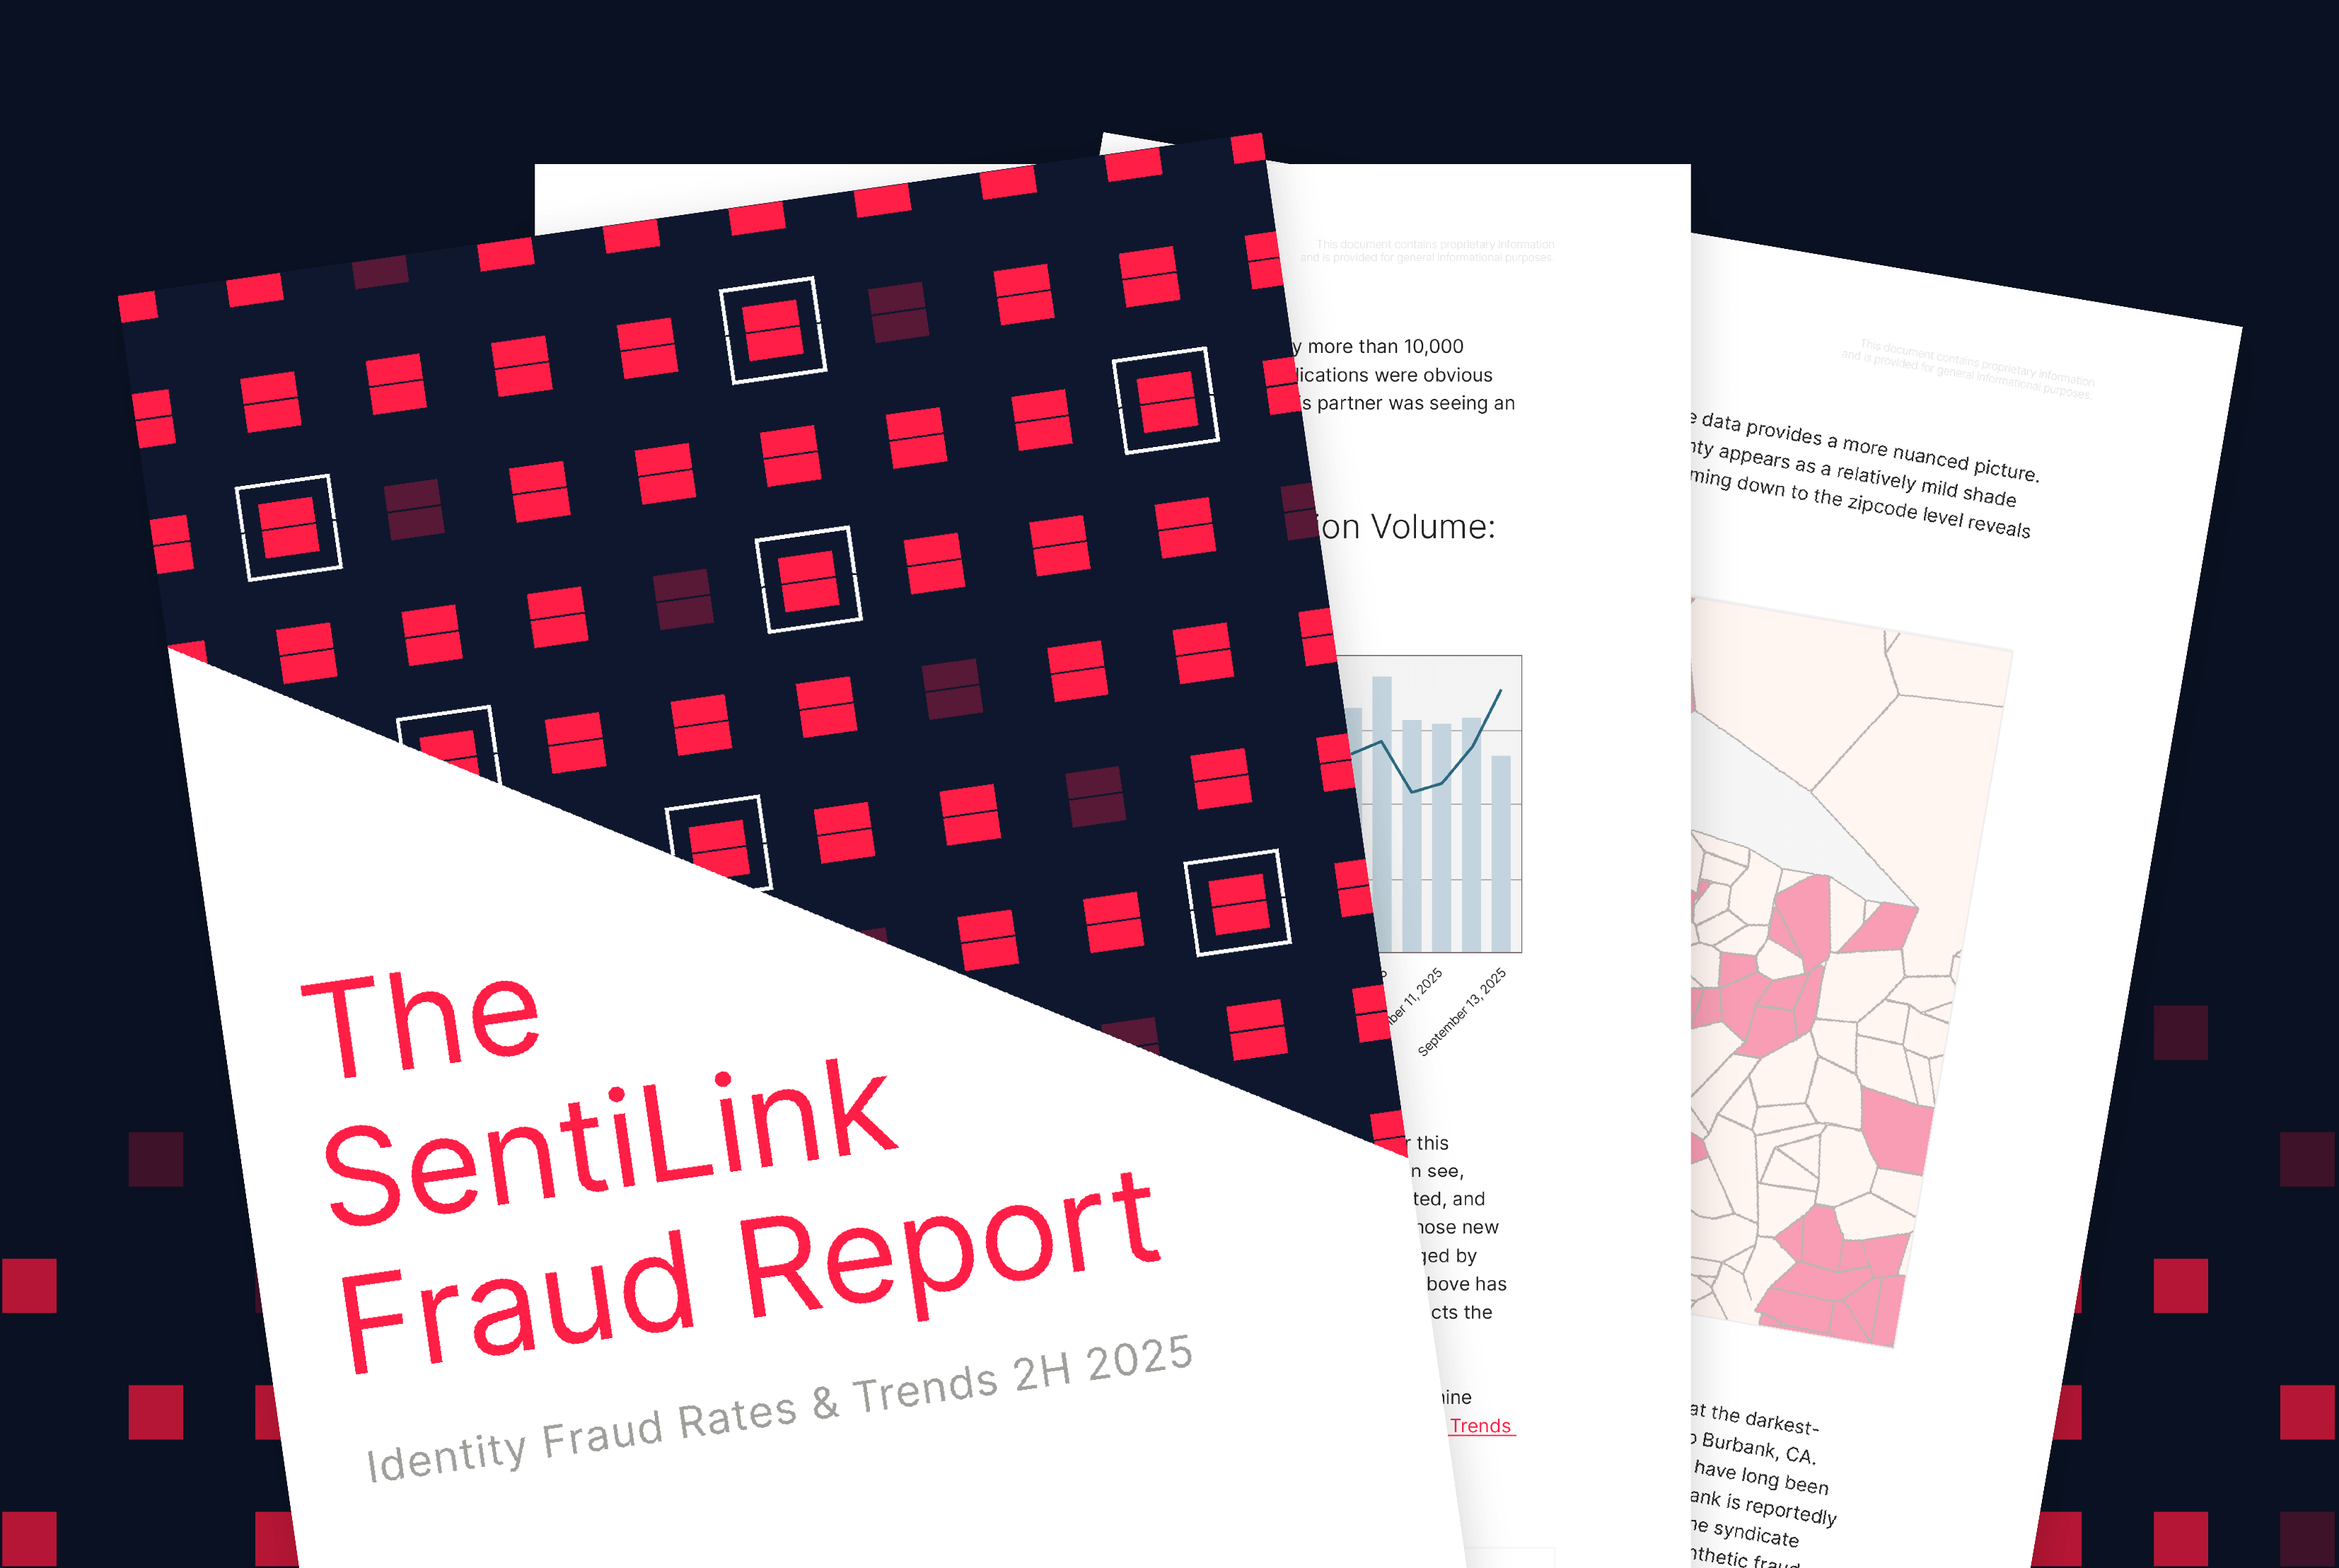
To provide a more real-time view into how fraudsters are attacking financial institutions (FIs) and other organizations, SentiLink has released The SentiLink Fraud Report: Identity Fraud Rates & Trends 2H 2025, featuring identity theft rates, synthetic fraud rates, and now also first-party fraud rates.
The report is based on a rigorous analysis of more than 236 million account-opening applications. In it, we report fraud rates overall and within five key industries: credit cards, demand deposit accounts (DDA), auto lending, other consumer lending (including BNPL/AltFi), and telecom.
In addition to fraud rates, the report covers major fraud trends and targeted attacks observed by SentiLink researchers and our Fraud Intelligence Team (FIT) during the second half of 2025.
Get your free copy of the report today!
What were the fraud rates in 2H 2025?
Overall, we found a mean identity theft rate of 5.61% and a mean synthetic fraud rate of 0.58% over the second half of 2025.
The identity theft rate climbed over the half, reaching its highest point of the year during the December holiday season (peaking at 6.75% in the week of Christmas). Meanwhile, the synthetic fraud rate fell slightly over the half, declining from roughly 67 bps to 48 bps, and averaging 58 bps overall.
We also mapped out hotspots for identity theft (left) and synthetic fraud (right):

What else is in the report?
Quite a lot! The full report runs 53 pages, not counting a lengthy appendix section that details all of our analysis methodology. Here are some of the things you'll find in your free copy of the full report:
- Weekly fraud rates by industry
- Fraud signal analyses that help highlight what application-level signals are most indicative of fraud by industry
- Time-of-day and day-of-week fraud rate analysis
- Analysis of the use of ITIN identities in identity theft
- How first-party and third-party synthetic fraud rates differ across industries
- Deep dives into several major fraud attacks
- Deep dives into notable fraud trends and MOs we observed in 2025
- Example case studies
- …and much more!
We’re giving this report away because we believe better fraud prevention starts with better data.
Get your free copy of the report today!
Where do these numbers come from?
The report is based on our observations as we verify 3M+ identities per day to help 500+ partners combat fraud. We selected a subset of more than 236 million real account opening applications to which we could assign fraud probabilities for both identity theft and synthetic fraud based on real-world performance data. We then calculated fraud rates based on these probabilities.
The methodology for the first-party fraud rates and other analyses differed; the full details are included in the report's transparent appendix, which covers methodology, sample sizes, and limitations:

Grab your copy of the report and see for yourself. (And if you still have questions or would like to make suggestions for future reports, we would love to hear from you!)
Subscribe
Share
Related Content

Blog article
June 26, 2026
We Went Looking for a Missing Corvette. We Found a Machine for Laundering Cars
Read article
Blog article
June 16, 2026
Where Do Fraudsters Start With Stolen Identities?
Read article
Blog article
June 10, 2026
$1.8 Million in Cars Went Missing. Could a Machine Learning Model Have Prevented It?
Read article