Charlie Custer
Published
August 18, 2026
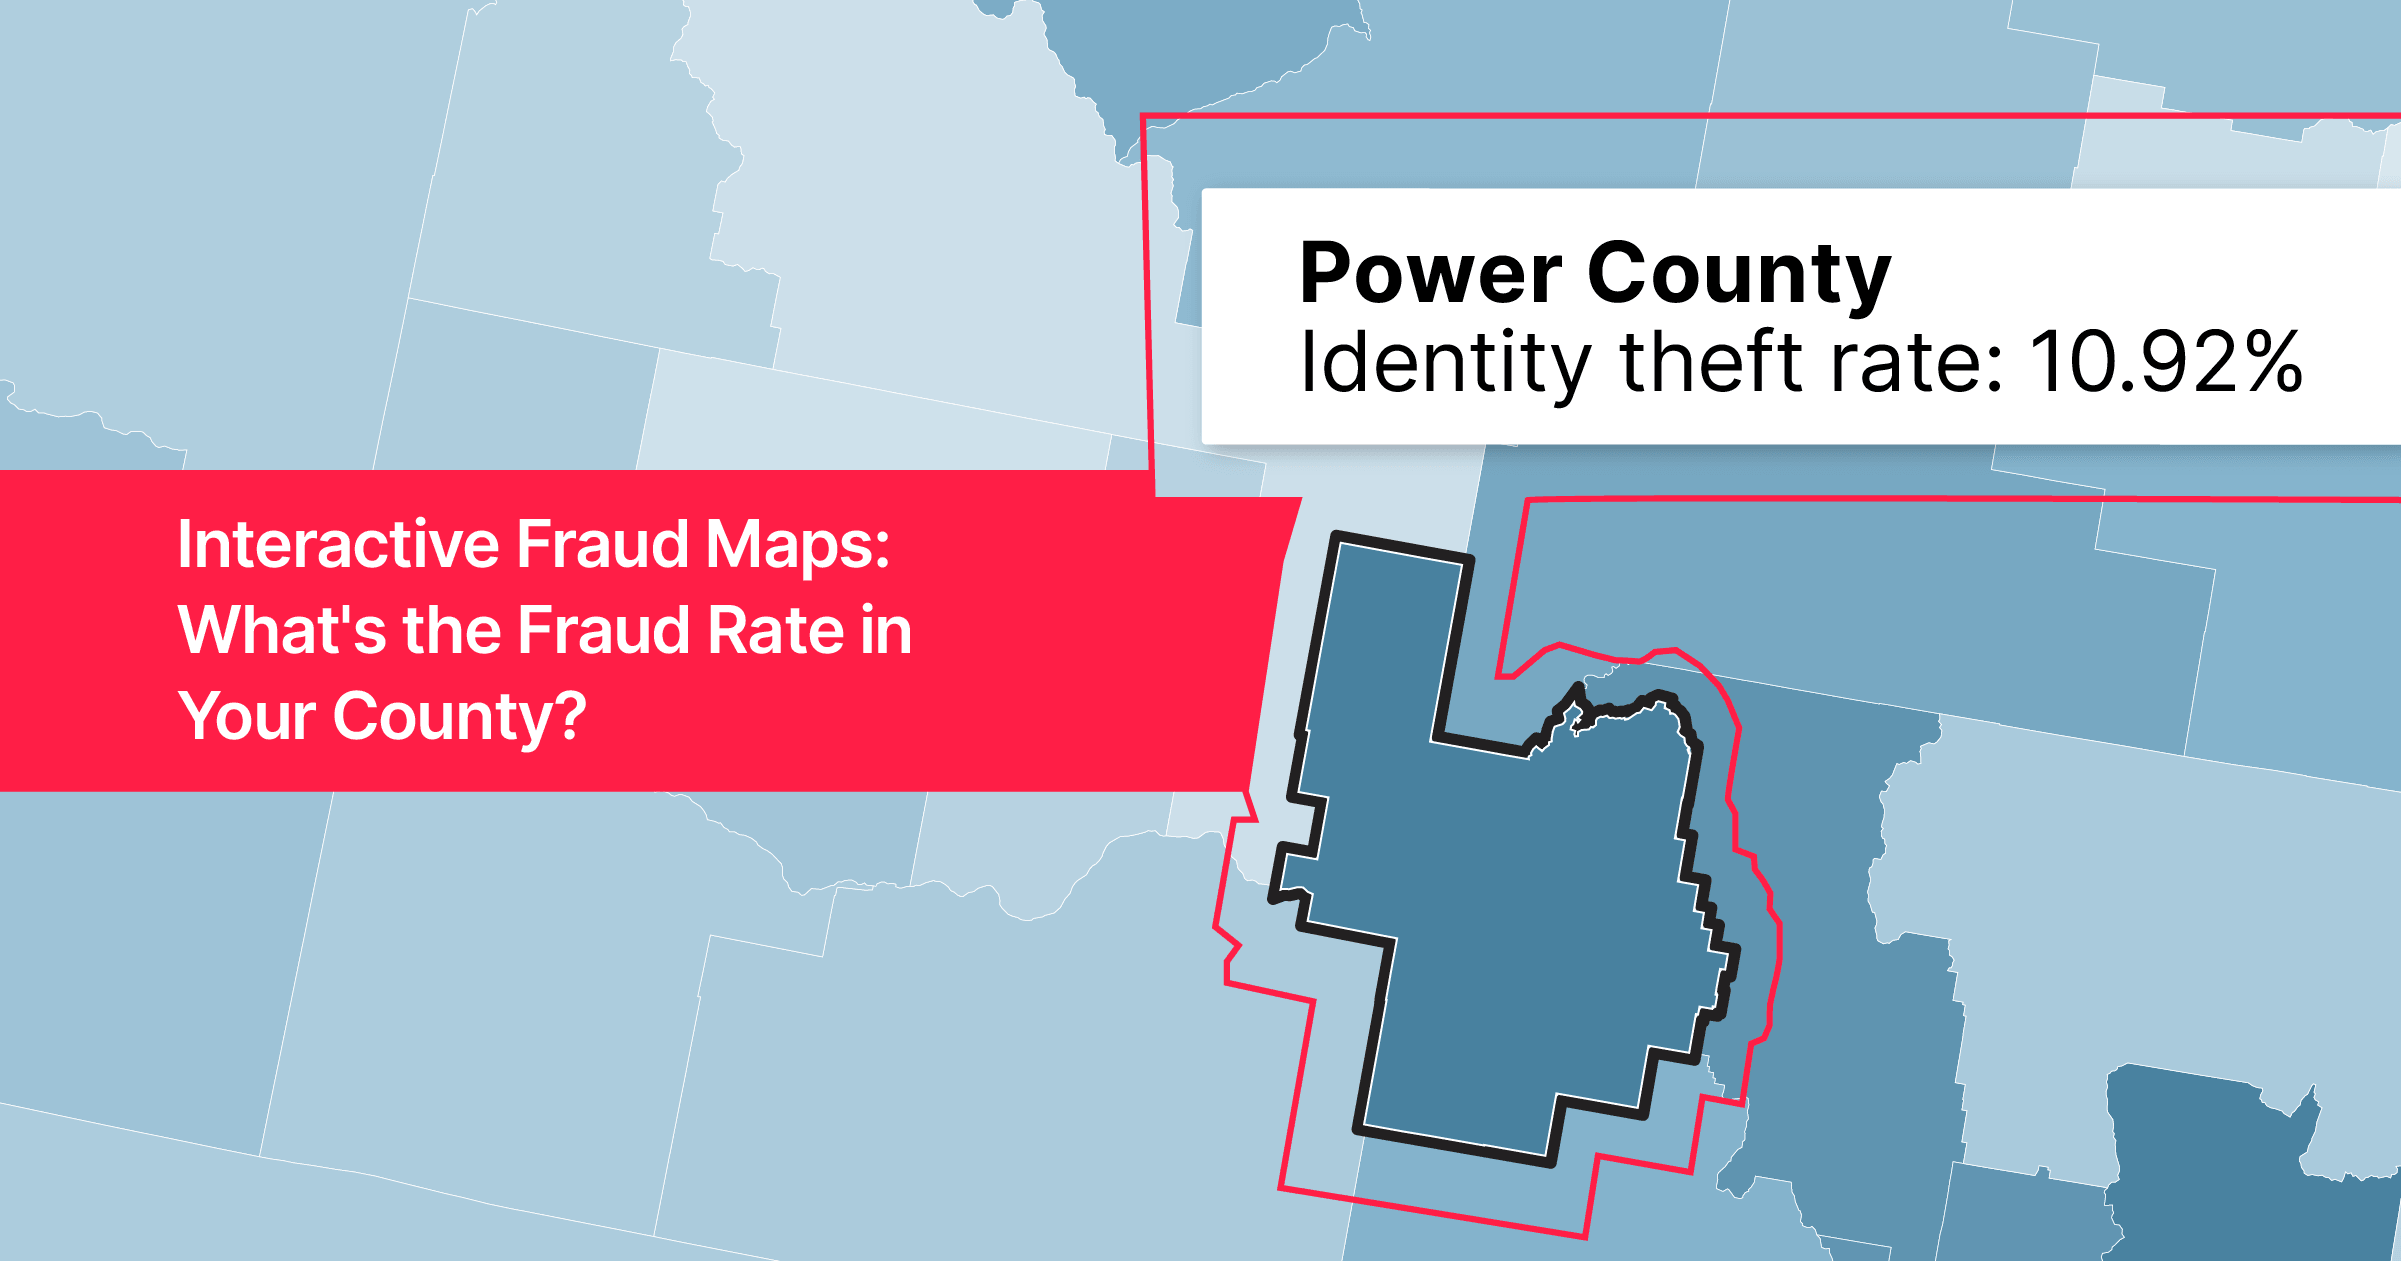
SentiLink's 1H 2026 Fraud Report is now available. Like previous reports, it contains heatmaps of the United States with per-county fraud rate data covering identity theft, synthetic fraud, and first-party fraud.
New for this edition of the report, though, we're also including these maps in an interactive, searchable format. In the maps embedded below you can:
- Zoom (hold
Ctrl) - Pan (click and drag after zooming)
- Mouseover a county to see its name and rate
- Search (top left) for a specific county to see its rate.
These maps are based on the application address, which means that the identity theft map roughly reflects where victims are located, whereas the synthetic fraud and first-party fraud maps roughly reflect where those types of fraudsters are located.
For methodology details and additional context, please refer to the full Fraud Report, which is free and available now.
That's just the tip of the iceberg. Check out the full fraud report for 50+ pages of in depth analysis including fraud rates by industry, breakdowns of specific targeted fraud attacks, fraud trends we've observed over the course of the half, and a wide variety of additional analyses. Grab your free copy now!
Subscribe
Share


Related Content


.png)